

We all know about there is hundreds test available to check our body health to monitor any changes. There are ready mad handheld tools available on the market to check blood glucose level, blood pressure monitor, body fat analyzer, heart rate monitor, soon. Like us, the computer may have experienced some difficulties as time passes. We didn’t care about anything other than us, may be due to if anything happened to us suddenly, who will take care of us? If something happened to our computer, we have to simply replace the motherboard, ram, hard disk, CPU or even the computer itself with a new computer. It requires time and money and some data recovery and transfer process.
Thinking that our computers have a beautiful mind like us, we have to monitor and noticed the changes as it happened. Likely, computers have also a number of inbuilt and ready to install tools available to monitor and report problems as it arises. Some tools can some optimize and repair feature to correct some errors as they can. Let’s check some of them.
Task Manager
Task Manager is a well-known application available inside Windows, probably you heard or used it if you are an experienced Windows user. Task manager is there for monitoring processes on the Microsoft Windows operating system. Task Manager was introduced with Windows NT, it provides information about the current system state. This application shows all applications running at that time and its current state. To find ‘task manager’ just search “task manager” on the search box.
Performance Monitor
This is also a pre-built with windows, performance monitoring tool. Performance Monitor acts as a real-time and as a log-based performance monitoring tool for OS. The Performance Monitor counts the performance by making system calls retrieve system counters. To find ‘performance monitor’ just search “performance monitor” on the search box.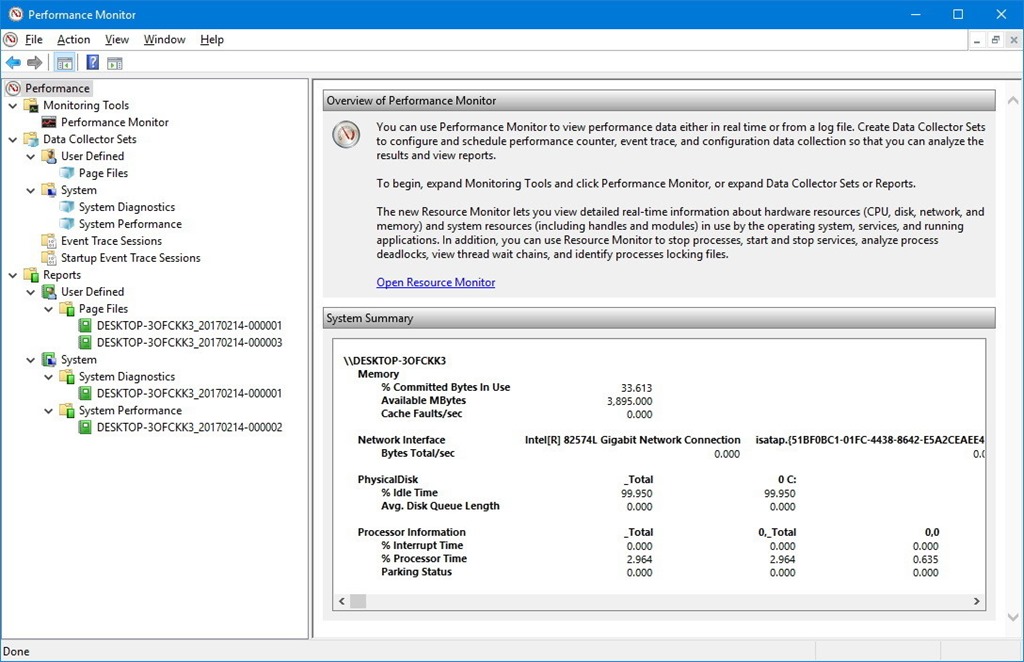
The next two tools from the original CPU and chipset manufacturers, Intel and AMD.
Intel XTU
(https://intel.com)
Intel XTU tool is from the original processor manufacturer Intel. This simple Windows-based performance-tuning software helps to overclock, monitor, and stress a system. The software gives a set of robust features common in most enthusiast platforms along with special new features available on new Intel Application Processors and Intel Motherboards.
AMD Ryzen Master
(https://www.amd.com/)
Every AMD Ryzen processor is multiplier-unlocked from the factory, AMD provides the AMD Ryzen Master utility to access this powerful advantage, you can personalize performance to your taste with this tool. AMD Ryzen Master provides for up to four profiles to store custom clocks and voltage adjustments for both the Ryzen CPU and DDR4 memory. You can park cores and adjust memory timings. AMD Ryzen Master has you covered with both real-time monitoring and a histogram of per-core clock rates and temperature, including average and peak readings.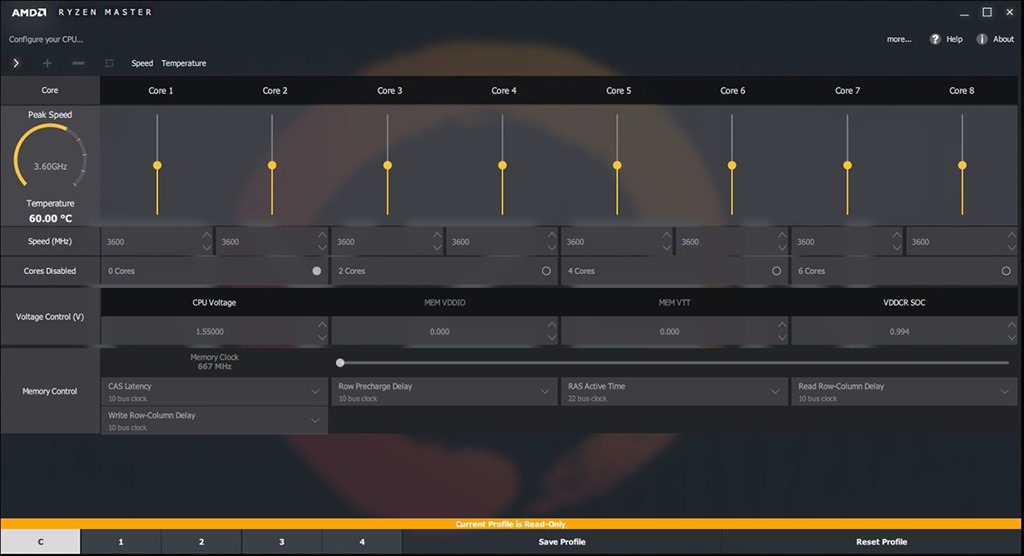
Now we are going to discuss some tools available online, you check it and download from the corresponding location.
HWMonitor
(https://www.cpuid.com/)
HWmonitor is also a hardware monitoring tool that reads your computer main health sensors like voltages, temperatures and fans speed. The program handles the most common sensor chips. The tool can read modern CPUs on-die core thermal sensors, as well as hard drives temperature via S.M.A.R.T, and video card GPU temperature.
CPU-Z
(https://www.cpuid.com/softwares/cpu-z.html)
CPU-Z is a popular freeware (you may know it) that obtain information on some of the main devices of your system like Processor name and number, codename, process, package, cache levels, mainboard and chipset, memory type, size, timings, and module specifications and real-time measurement of each core’s internal frequency, memory frequency, etc.
HWiNFO
(https://www.hwinfo.com)
With this tool, you will get a quick overview of all hardware components. This tool accurately monitors all system components for actual status and failure prediction. It has an easily customizable interface screen with a variety of options. It supports multiple types of reports, status logging and interfacing with other tools. Reports can be obtained as a text file, CSV, XML, HTML report and log files.
AIDA64
(https://www.aida64.com/products/aida64-extreme)
AIDA64 has a hardware detection engine that provides detailed information about installed software and offers diagnostic functions and support for overclocking. The tool monitors sensors in real time, it can gather accurate voltage, temperature and fan speed readings. The diagnostic functions in it help to detect and prevent hardware issues. A unique feature is the availability of a couple of benchmarks, for measuring either the performance of individual hardware components or the whole system.
Core Temp
(http://www.alcpu.com/CoreTemp/)
Core Temp a sleek, compact, no fuss, small footprint, powerful program to monitor processor temperature and other vital information. Core Temp is capable of displaying a temperature of each individual core of every processor in your system. You can see temperature fluctuations in real time with varying workloads. Core Temp is also motherboard agnostic.
SpeedFan
(http://www.almico.com/speedfan.php)
SpeedFan is also a popular tool to access digital sensors available on your pc. By accessing available hardware monitor chips, SpeedFan can show temperatures, voltages and fan speeds. SpeedFan can show S.M.A.R.T. data from almost every hard disk too. Temperature sensors from almost every manufacturer are automatically detected and accessed. If your hardware allows it and you properly configured SpeedFan, you can change fan speeds depending on system temperatures, thus reducing overall noise. You can fine-tune your hardware using advanced configuration. You can fix wrong temperature readings if you discover that an offset is needed because the manufacturer put the actual sensor slightly away from the monitored chip. The most important options here allow you to enable software fan speed control. By setting the remember it options you can tell SpeedFan to set that option whenever it starts and whenever your system resumes from standby.
S.M.A.R.T. (or SMART) is a technology that allows the end user query the hard drive about its health and, usually, performances. Fan speeds can be controlled by means of custom response curves. Different temperatures can have different response curves and multiple temperatures can control each fan speed.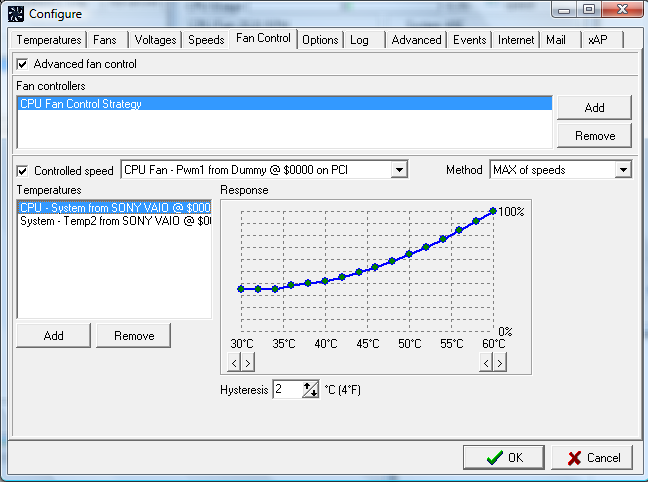
Bottom Line
We have discussed a list of tools to monitor your computer sensors and to read voltages, temperatures, and fans speed. Information related to microprocessor name and number, manufacturer, codename, process, package, cache levels, mainboard and chipset, memory type, size, timings, etc. No one can fool you by giving a ready-made system without a proper configuration, you can download and install any one of these tools and can see the system setup, settings, and performance. In these days, a number of processors in different generations and different generation memory chips with different capacities are available in the market. Without the help of a technician, you can yourself check the ingredients of your system, thus by ensuring you have received the correct configuration as you suggested.